Population Distribution
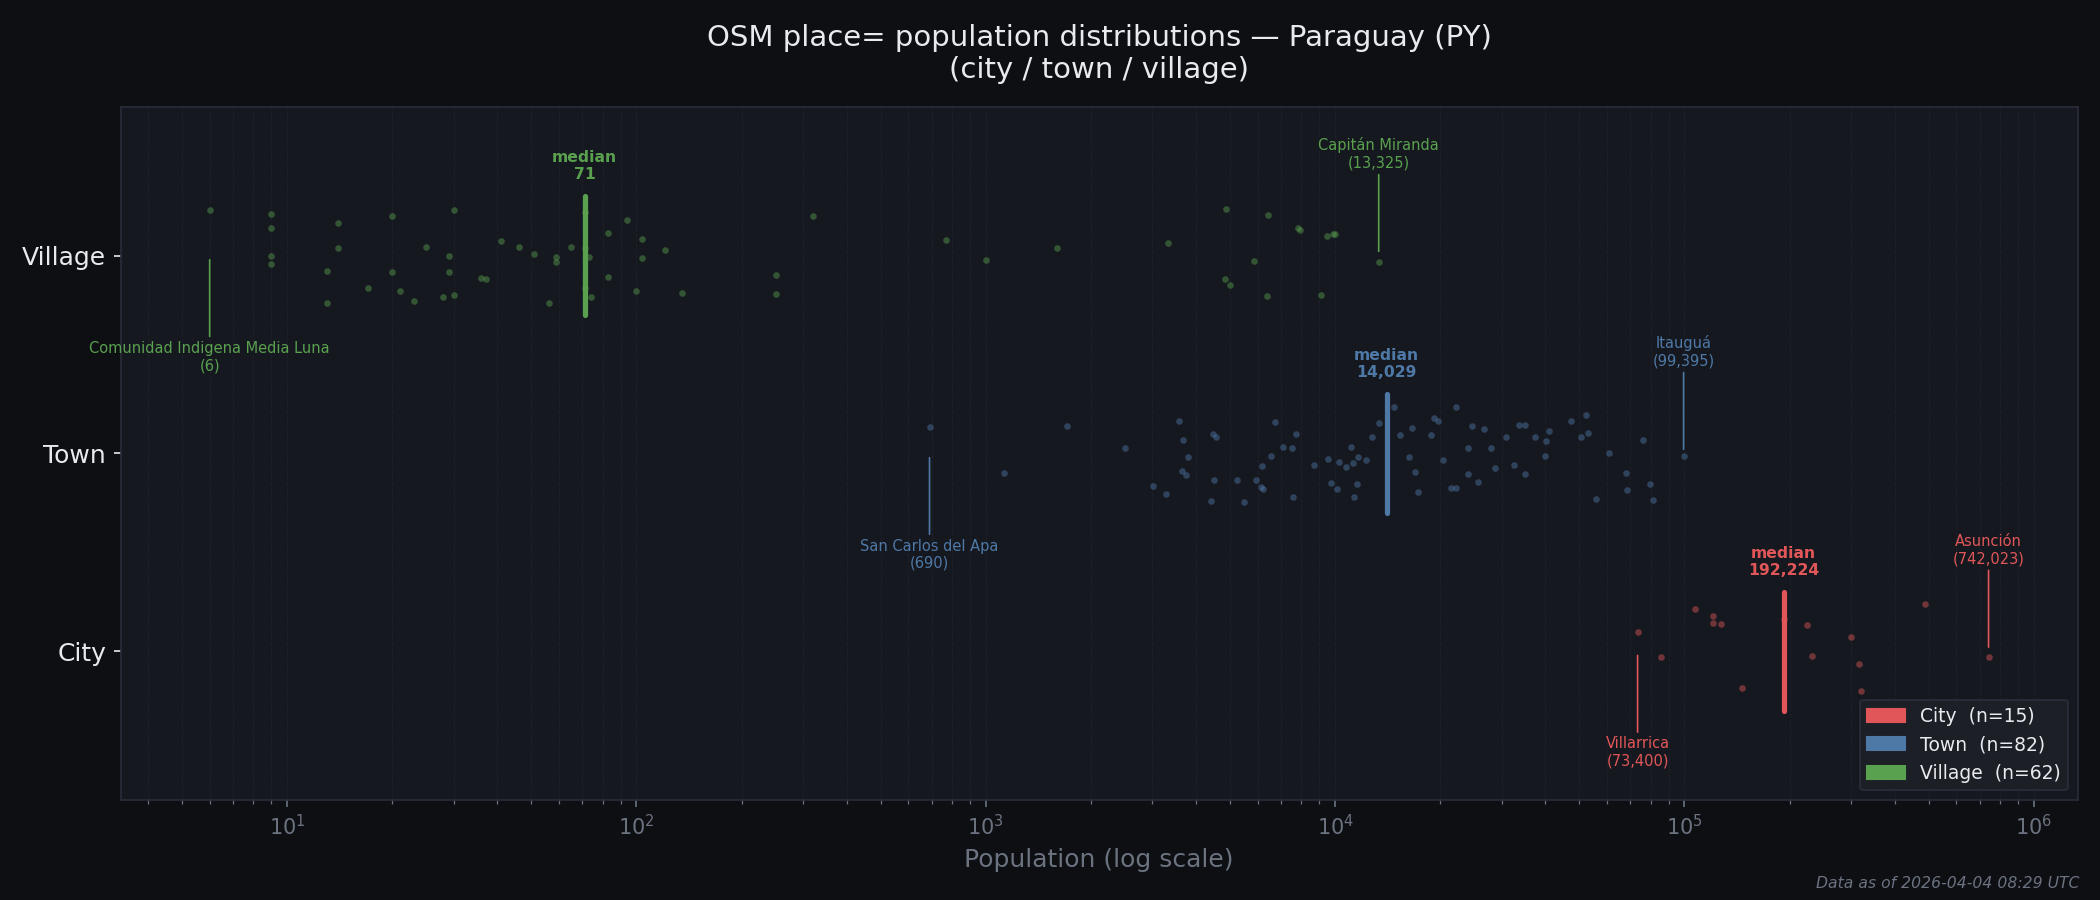
Population distribution by place type for Paraguay. Dots show individual tagged places, with the maximum, minimum, and median population values highlighted.
Upgrade Candidates
Places whose population is more consistent with the next-higher type's distribution than their own. Ranked by signal strength, then percentile within current type.
| # | Name | Type | Population | Own %ile | %ile among next higher | Signal | Edit | OSM |
|---|---|---|---|---|---|---|---|---|
| 1 | Capitán Miranda | village | 13,325 | 100% | 50% | Strong | node/4973189939 | |
| 2 | Fram | village | 10,000 | 98% | 37% | Strong | node/4956813467 | |
| 3 | San Cosme y Damián | village | 9,856 | 97% | 37% | Strong | node/1732011302 | |
| 4 | Trinidad | village | 9,494 | 95% | 34% | Strong | node/1426522647 | |
| 5 | San Lázaro | village | 9,101 | 94% | 34% | Strong | node/1796810769 | |
| 6 | General Delgado | village | 7,950 | 92% | 33% | Strong | node/4937394644 | |
| 7 | Nueva Alborada | village | 7,805 | 90% | 33% | Strong | node/1722779457 | |
| 8 | Loma Grande | village | 6,403 | 89% | 26% | Strong | node/1319032286 | |
| 9 | Jesús de Tavarangüé | village | 6,363 | 87% | 26% | Strong | node/684913471 | |
| 10 | Nanawa | village | 5,846 | 86% | 21% | Strong | node/1765238659 | |
| 11 | Itauguá | town | 99,395 | 100% | 13% | Weak | node/1763575232 | |
| 12 | Itá | town | 81,084 | 99% | 7% | Weak | node/2211962256 | |
| 13 | Hernandarias | town | 79,735 | 98% | 7% | Weak | node/648476706 | |
| 14 | Areguá | town | 75,858 | 96% | 7% | Weak | node/313911833 | |
| 15 | Presidente Franco | town | 68,242 | 95% | 0% | Weak | node/660785278 | |
| 16 | San Antonio | town | 68,127 | 94% | 0% | Weak | node/6813083835 | |
| 17 | Loteamiento Aurora | village | 5,000 | 84% | 18% | Weak | node/2868216038 | |
| 18 | Puerto Pinasco | village | 4,869 | 82% | 18% | Weak | node/1488406016 | |
| 19 | José Leandro Oviedo | village | 4,843 | 81% | 18% | Weak | node/1462142670 | |
| 20 | La Paz | village | 3,333 | 79% | 7% | Weak | node/4986031540 |
Downgrade Candidates
Places whose population is more consistent with the next-lower type's distribution than their own. Ranked by signal strength, then percentile within current type.
| # | Name | Type | Population | Own %ile | %ile among next lower | Signal | Edit | OSM |
|---|---|---|---|---|---|---|---|---|
| 1 | San Carlos del Apa | town | 690 | 1% | 73% | Strong | node/1796900476 | |
| 2 | Nueva Germania | town | 1,124 | 2% | 76% | Strong | node/2180408297 | |
| 3 | Pozo Colorado | town | 1,706 | 4% | 77% | Weak | node/313927553 |
Monitor
Places that are consistent with their current type's distribution but sit at an extreme percentile within it. No reclassification signal yet, but worth revisiting as more population data is tagged.
| # | Name | Type | Population | Own %ile | Edit | OSM |
|---|---|---|---|---|---|---|
| 1 | Cambyretá | town | 60,722 | 93% | node/2899038353 | |
| 2 | Horqueta | town | 55,882 | 92% | node/333676385 | |
| 3 | San Estanislao | town | 52,983 | 90% | node/1462293857 | |
| 4 | Ñumí | town | 3,637 | 10% | node/416673259 | |
| 5 | San Patricio | town | 3,570 | 8% | node/849647428 | |
| 6 | Itanará | town | 3,276 | 7% | node/2705275802 | |
| 7 | Villarrica | city | 73,400 | 7% | node/313912581 | |
| 8 | Nueva Esperanza | town | 3,018 | 6% | node/2690856434 | |
| 9 | Paso Yobái | town | 2,500 | 5% | node/2657475410 |