Population Distribution
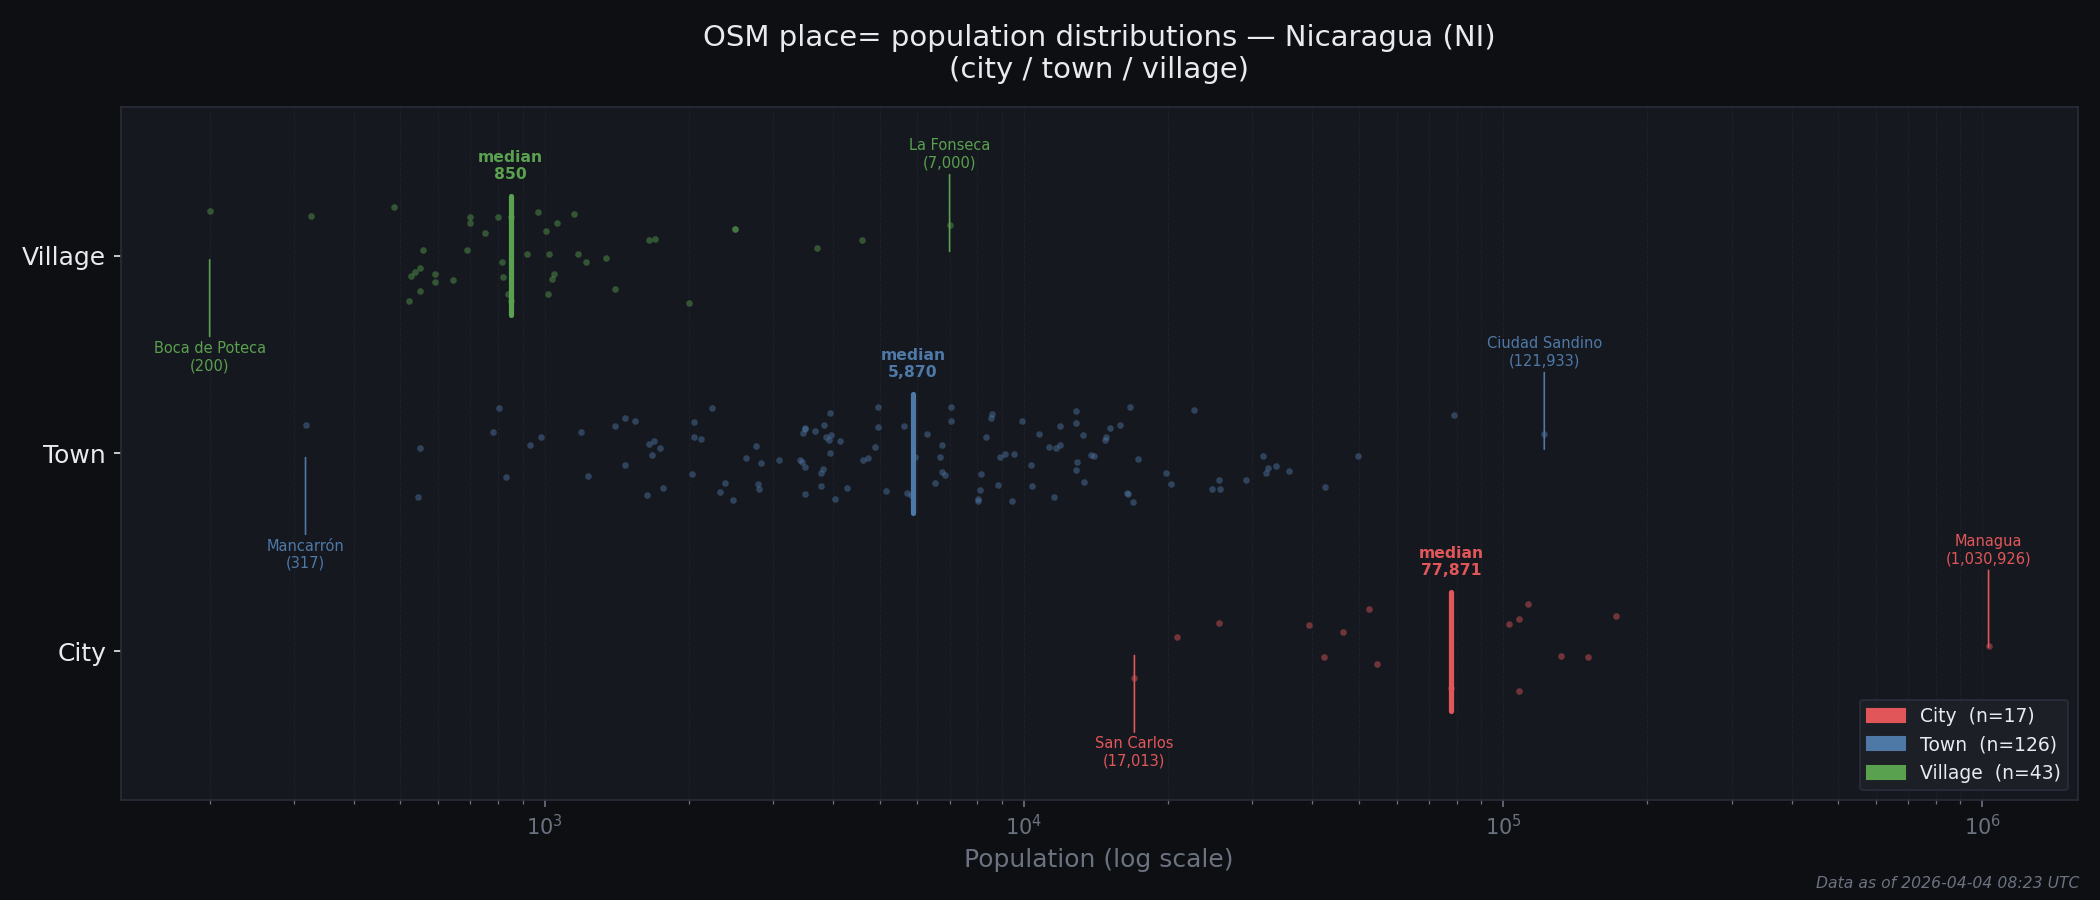
Population distribution by place type for Nicaragua. Dots show individual tagged places, with the maximum, minimum, and median population values highlighted.
Upgrade Candidates
Places whose population is more consistent with the next-higher type's distribution than their own. Ranked by signal strength, then percentile within current type.
| # | Name | Type | Population | Own %ile | %ile among next higher | Signal | Edit | OSM |
|---|---|---|---|---|---|---|---|---|
| 1 | La Fonseca | village | 7,000 | 100% | 56% | Strong | node/4489534805 | |
| 2 | Tipitapa | town | 79,000 | 99% | 53% | Strong | node/291471414 | |
| 3 | Chichigalpa | town | 49,793 | 98% | 35% | Strong | node/302364870 | |
| 4 | Marvin Corrales | village | 4,595 | 98% | 43% | Strong | node/12613399564 | |
| 5 | San Rafael del Sur | town | 42,417 | 98% | 29% | Strong | node/2117609599 | |
| 6 | Las Maderas | village | 3,700 | 95% | 33% | Strong | node/302360985 | |
| 7 | Ciudad Sandino | town | 121,933 | 100% | 76% | Weak | node/2465725219 | |
| 8 | El Sauce | town | 35,707 | 97% | 18% | Weak | node/302362469 | |
| 9 | El Viejo | town | 33,607 | 96% | 18% | Weak | node/302364502 | |
| 10 | Nagarote | town | 32,303 | 95% | 18% | Weak | node/290862240 | |
| 11 | La Concepción | town | 31,950 | 94% | 18% | Weak | node/2563863016 | |
| 12 | Masatepe | town | 31,583 | 94% | 18% | Weak | node/302522652 | |
| 13 | San Enrique | village | 2,500 | 93% | 22% | Weak | node/3913517343 | |
| 14 | Mata de Caña | village | 2,500 | 93% | 22% | Weak | node/12437207274 | |
| 15 | San Marcos | town | 29,019 | 93% | 18% | Weak | node/302522720 | |
| 16 | Villanueva | town | 25,660 | 92% | 18% | Weak | node/302551979 | |
| 17 | Nueva Guinea | town | 25,585 | 91% | 18% | Weak | node/306573975 | |
| 18 | Mateare | town | 24,680 | 90% | 12% | Weak | node/2905099224 | |
| 19 | El Rama | town | 22,708 | 90% | 12% | Weak | node/13098922114 |
Downgrade Candidates
Places whose population is more consistent with the next-lower type's distribution than their own. Ranked by signal strength, then percentile within current type.
| # | Name | Type | Population | Own %ile | %ile among next lower | Signal | Edit | OSM |
|---|---|---|---|---|---|---|---|---|
| 1 | El Jicaral | town | 780 | 3% | 37% | Strong | node/2825591209 | |
| 2 | Karawala | town | 802 | 4% | 40% | Strong | node/2715824415 | |
| 3 | La Cruz de Río Grande | town | 829 | 5% | 44% | Strong | node/2724188854 | |
| 4 | Cárdenas | town | 934 | 6% | 54% | Strong | node/3892176308 | |
| 5 | Greytown | town | 985 | 6% | 56% | Strong | node/979906391 | |
| 6 | Cinco Pinos | town | 1,192 | 7% | 74% | Strong | node/2750799726 | |
| 7 | Santo Tomás del Norte | town | 1,229 | 8% | 77% | Strong | node/2751678478 | |
| 8 | Mancarrón | town | 317 | 1% | 2% | Weak | node/11229725056 | |
| 9 | Murra | town | 543 | 2% | 14% | Weak | node/306620988 | |
| 10 | Santa María | town | 549 | 2% | 14% | Weak | node/460388755 | |
| 11 | San Carlos | city | 17,013 | 6% | 86% | Weak | node/12437216582 | |
| 12 | San José de Cusmapa | town | 1,405 | 9% | 81% | Weak | node/2750666369 | |
| 13 | Ciudad Antigua | town | 1,469 | 10% | 81% | Weak | node/302524775 | |
| 14 | San Nicolás | town | 1,470 | 10% | 81% | Weak | node/2821147926 | |
| 15 | La Concordia | town | 1,546 | 11% | 81% | Weak | node/302524295 | |
| 16 | Somoto | city | 20,857 | 12% | 89% | Weak | node/2773644825 | |
| 17 | Yalagüina | town | 1,636 | 12% | 81% | Weak | node/2834238253 | |
| 18 | Rancho Grande | town | 1,648 | 13% | 81% | Weak | node/3898709882 | |
| 19 | Comalapa | town | 1,674 | 14% | 84% | Weak | node/4886139865 | |
| 20 | Alamikambang | town | 1,689 | 14% | 84% | Weak | node/2706221229 | |
| 21 | El Tortuguero | town | 1,737 | 15% | 86% | Weak | node/304252600 | |
| 22 | San José de los Remates | town | 1,763 | 16% | 86% | Weak | node/302360314 | |
| 23 | San Fernando | town | 2,034 | 17% | 88% | Weak | node/302524794 | |
| 24 | Santa Lucía | town | 2,046 | 18% | 88% | Weak | node/304247102 | |
| 25 | San Francisco Libre | town | 2,050 | 18% | 88% | Weak | node/1710205402 | |
| 26 | San Lucas | town | 2,124 | 19% | 88% | Weak | node/2834238251 | |
| 27 | Buenos Aires | town | 2,236 | 20% | 88% | Weak | node/4444985717 |
Monitor
Places that are consistent with their current type's distribution but sit at an extreme percentile within it. No reclassification signal yet, but worth revisiting as more population data is tagged.
No places in the monitor tier.