Whether a settlement is a village, town, or city depends on a mix of factors — population, character, local identity, available services, and geographic context — none of which point to a single clear answer. Areas near larger settlements may function as suburbs or neighbourhoods rather than distinct places, while remote settlements often feel more significant than raw numbers suggest. Since reasonable mappers frequently disagree on these judgements, any classification changes should be made thoughtfully and with awareness of local context.
Population Distribution
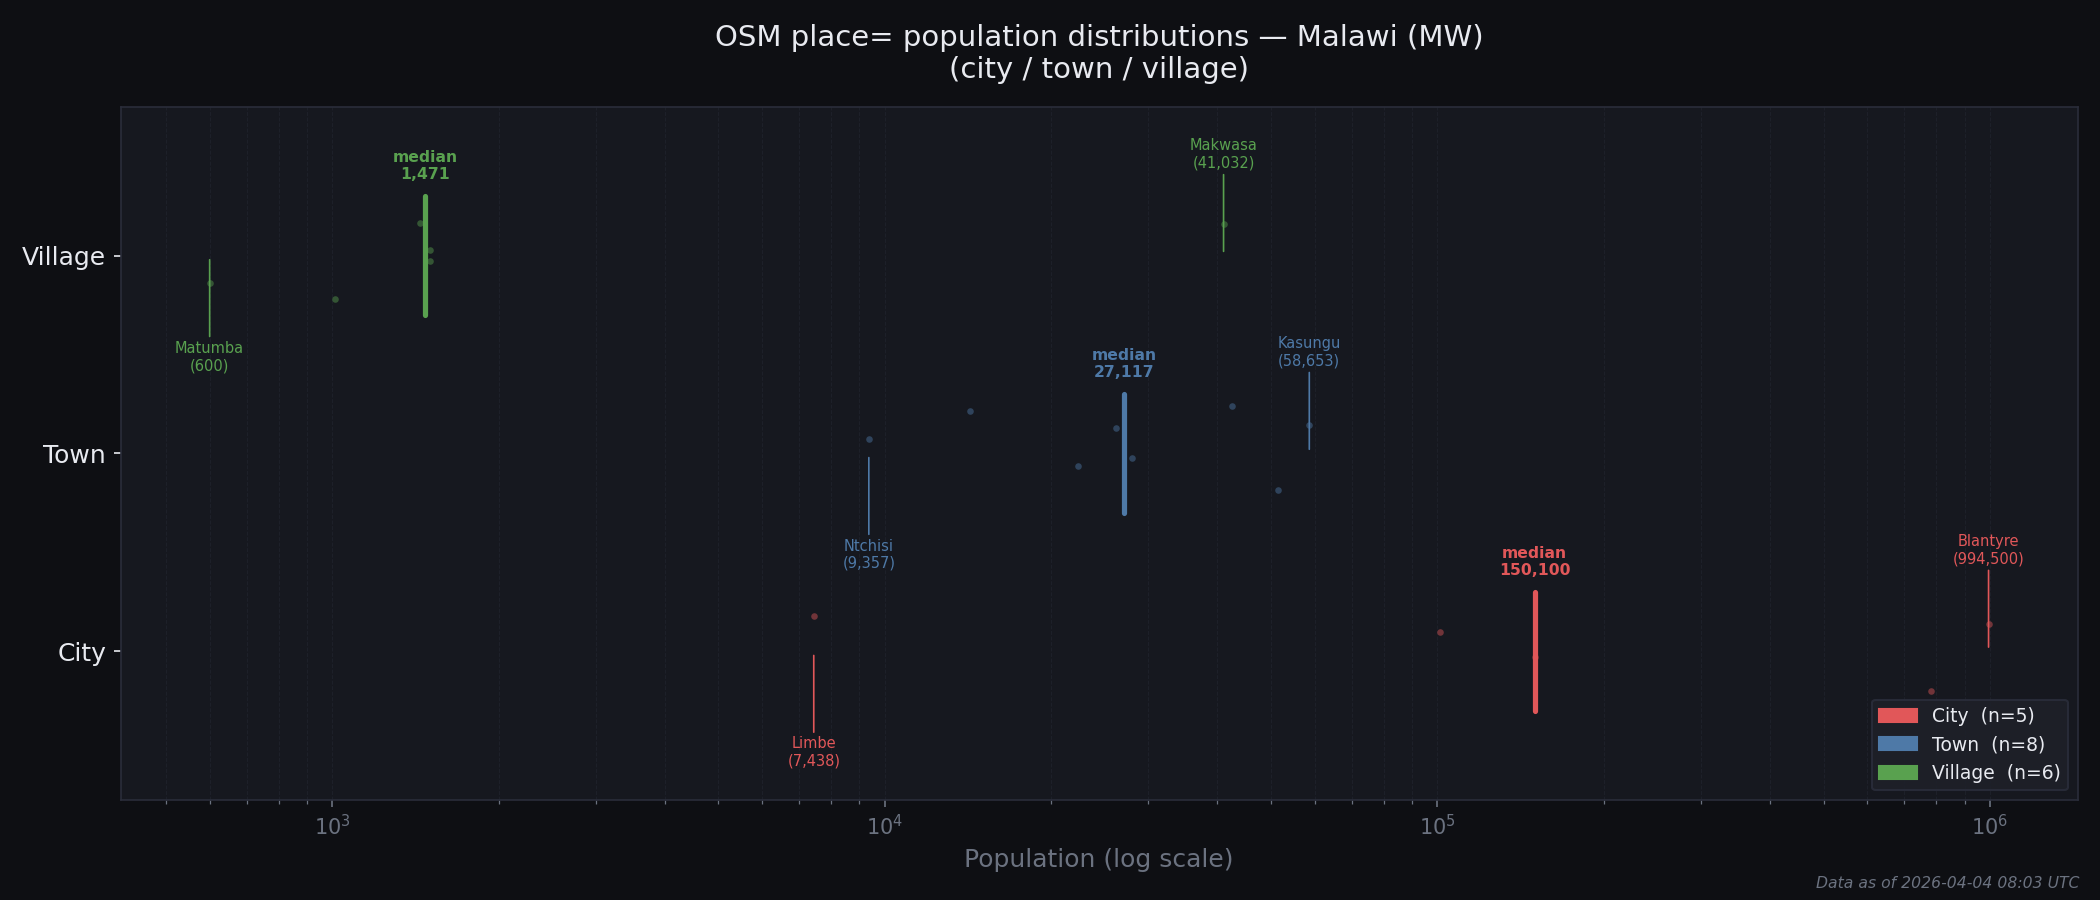
Population distribution by place type for Malawi.
Dots show individual tagged places, with the maximum, minimum, and median population values highlighted.
Upgrade Candidates
Places whose population is more consistent with the next-higher type's distribution than their own.
Ranked by signal strength, then percentile within current type.
Places whose population is more consistent with the next-lower type's distribution than their own.
Ranked by signal strength, then percentile within current type.
Places that are consistent with their current type's distribution but sit at an extreme
percentile within it. No reclassification signal yet, but worth revisiting as more
population data is tagged.
For each place type (city, town, village), a log-normal distribution is fitted
to the population values tagged in OSM. Specifically, the mean and standard deviation of
log₁₀(population) are computed, giving each type its own statistical fingerprint.
Step 2 — Log-likelihood ratio (LLR)
Each place is scored under its own type's distribution and under each adjacent type's distribution.
A positive LLR means the place's population fits the neighbouring type's
distribution better than its own — a statistical signal of potential misclassification.
If both adjacent types fire simultaneously, the stronger LLR determines the flag direction.
Step 3 — Percentile corroboration
The LLR signal is cross-checked against percentile ranks: where does this place
sit within its own type, and where would it land in the target type? Both signals must agree
for a candidate to be rated Strong.
LLR > 0, but one or more Strong conditions not met
Monitor
—
No LLR signal, but own percentile ≥ 90th (top) or ≤ 10th (bottom)
Why extremes are excluded from Strong
The target-type percentile window deliberately excludes both tails.
A place landing below the 20th percentile among the target type would be
marginal even there — a weak fit. A place landing above the 65th percentile
in the target type is unusually large even for that category, suggesting the reclassification
destination may be wrong (should jump two levels) or the tag is erroneous.
The middle range confirms the place would be a natural, unremarkable member of the
target type — the hallmark of a genuine misclassification.
Table sort order
Within each section, Strong candidates always appear before
Weak ones. Within each confidence tier, upgrade candidates are
sorted by own-type percentile descending (most overqualified first) and
downgrade candidates by own-type percentile ascending (most underqualified
first). Monitor entries are sorted by own-type percentile
descending.
Statistical flags are prompts for investigation, not conclusions. Place hierarchy in OSM
reflects infrastructure, administrative status, and regional importance — population alone
cannot capture that.