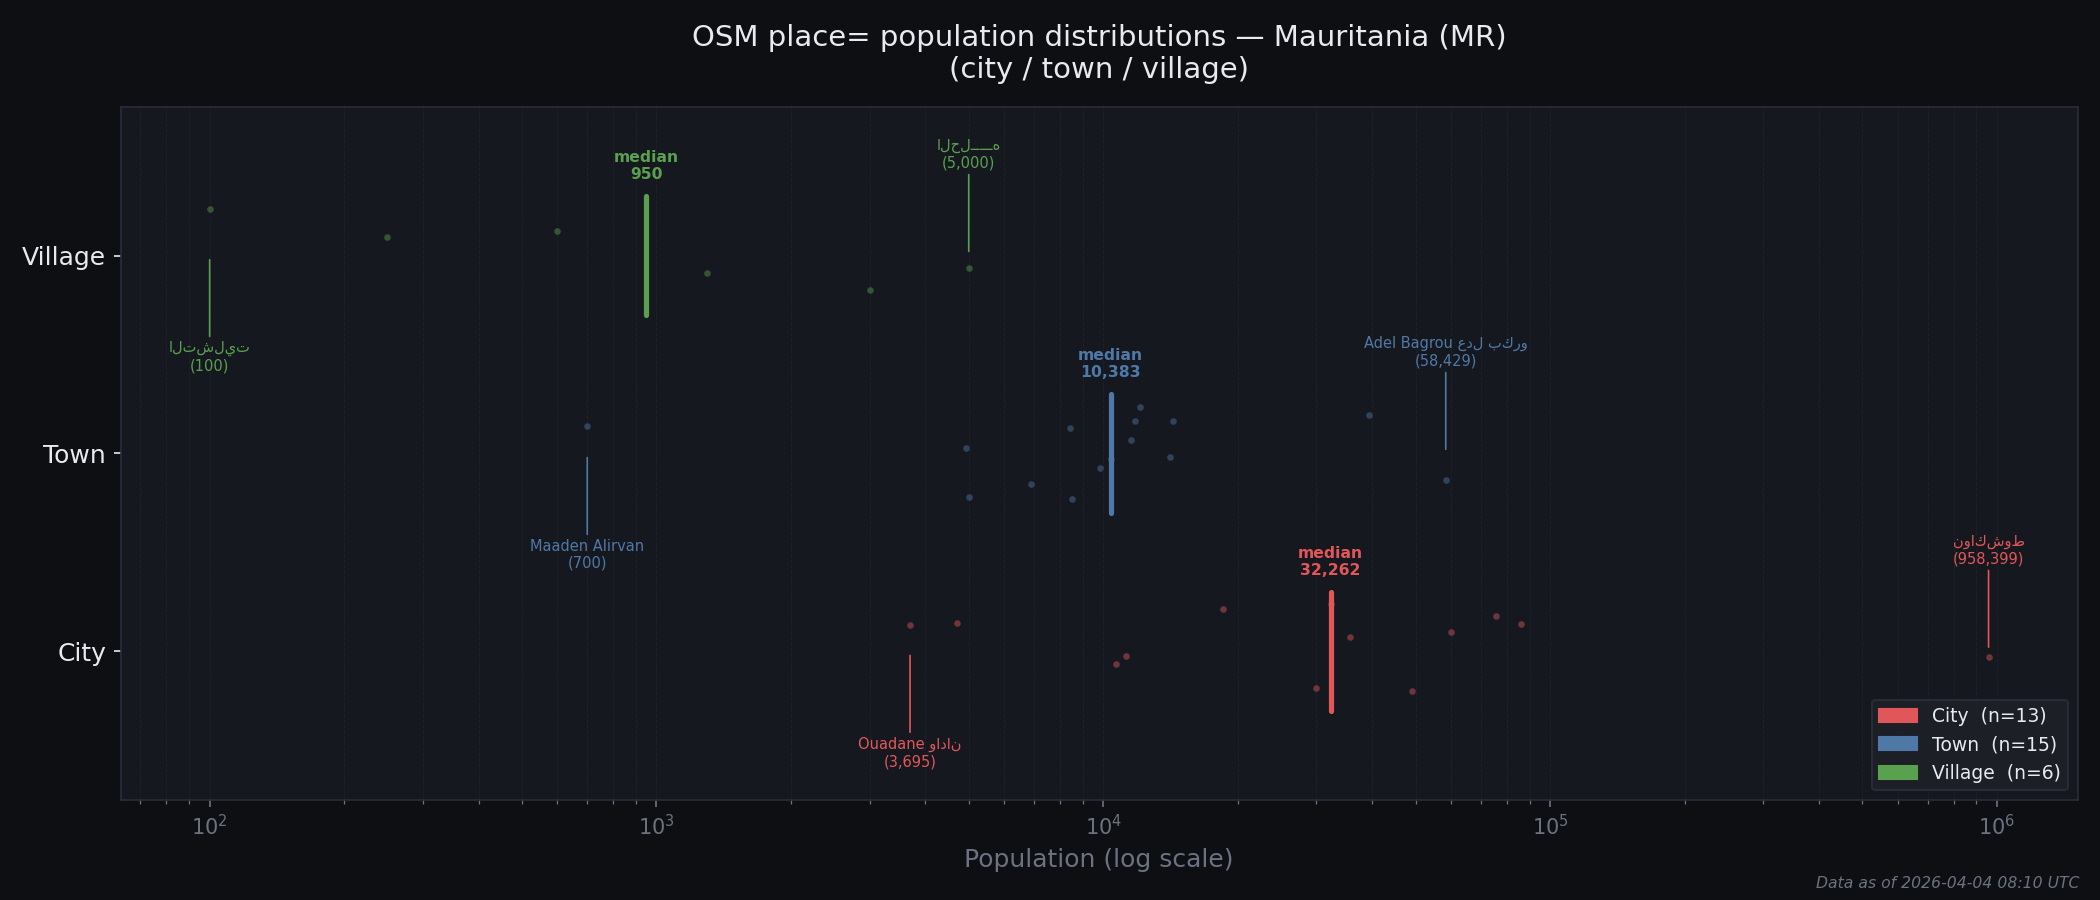
Population Distribution
Population distribution by place type for Mauritania. Dots show individual tagged places, with the maximum, minimum, and median population values highlighted.
Upgrade Candidates
Places whose population is more consistent with the next-higher type's distribution than their own. Ranked by signal strength, then percentile within current type.
| # | Name | Type | Population | Own %ile | %ile among next higher | Signal | Edit | OSM |
|---|---|---|---|---|---|---|---|---|
| 1 | Adel Bagrou عدل بكرو | town | 58,429 | 100% | 69% | Weak | node/1996697706 | |
| 2 | الحلـــــه | village | 5,000 | 100% | 20% | Weak | node/13130791967 | |
| 3 | Keur Macène كرمسين | town | 39,441 | 93% | 62% | Weak | node/4462901614 | |
| 4 | Birette برت | village | 3,000 | 83% | 7% | Weak | node/3177612254 |
Downgrade Candidates
Places whose population is more consistent with the next-lower type's distribution than their own. Ranked by signal strength, then percentile within current type.
| # | Name | Type | Population | Own %ile | %ile among next lower | Signal | Edit | OSM |
|---|---|---|---|---|---|---|---|---|
| 1 | Maaden Alirvan | town | 700 | 7% | 50% | Strong | node/4486500455 | |
| 2 | Ouadane وادان | city | 3,695 | 8% | 7% | Weak | node/330513843 | |
| 3 | Chinguetti شنقيط | city | 4,711 | 15% | 7% | Weak | node/330514595 | |
| 4 | R'Kiz اركيز | city | 10,688 | 23% | 53% | Weak | node/2099659530 | |
| 5 | Akjoujt أكجوجت | city | 11,235 | 31% | 53% | Weak | node/1505634228 | |
| 6 | Tidjikja تجكجة | city | 18,586 | 38% | 87% | Weak | node/2651917475 |
Monitor
Places that are consistent with their current type's distribution but sit at an extreme percentile within it. No reclassification signal yet, but worth revisiting as more population data is tagged.
No places in the monitor tier.