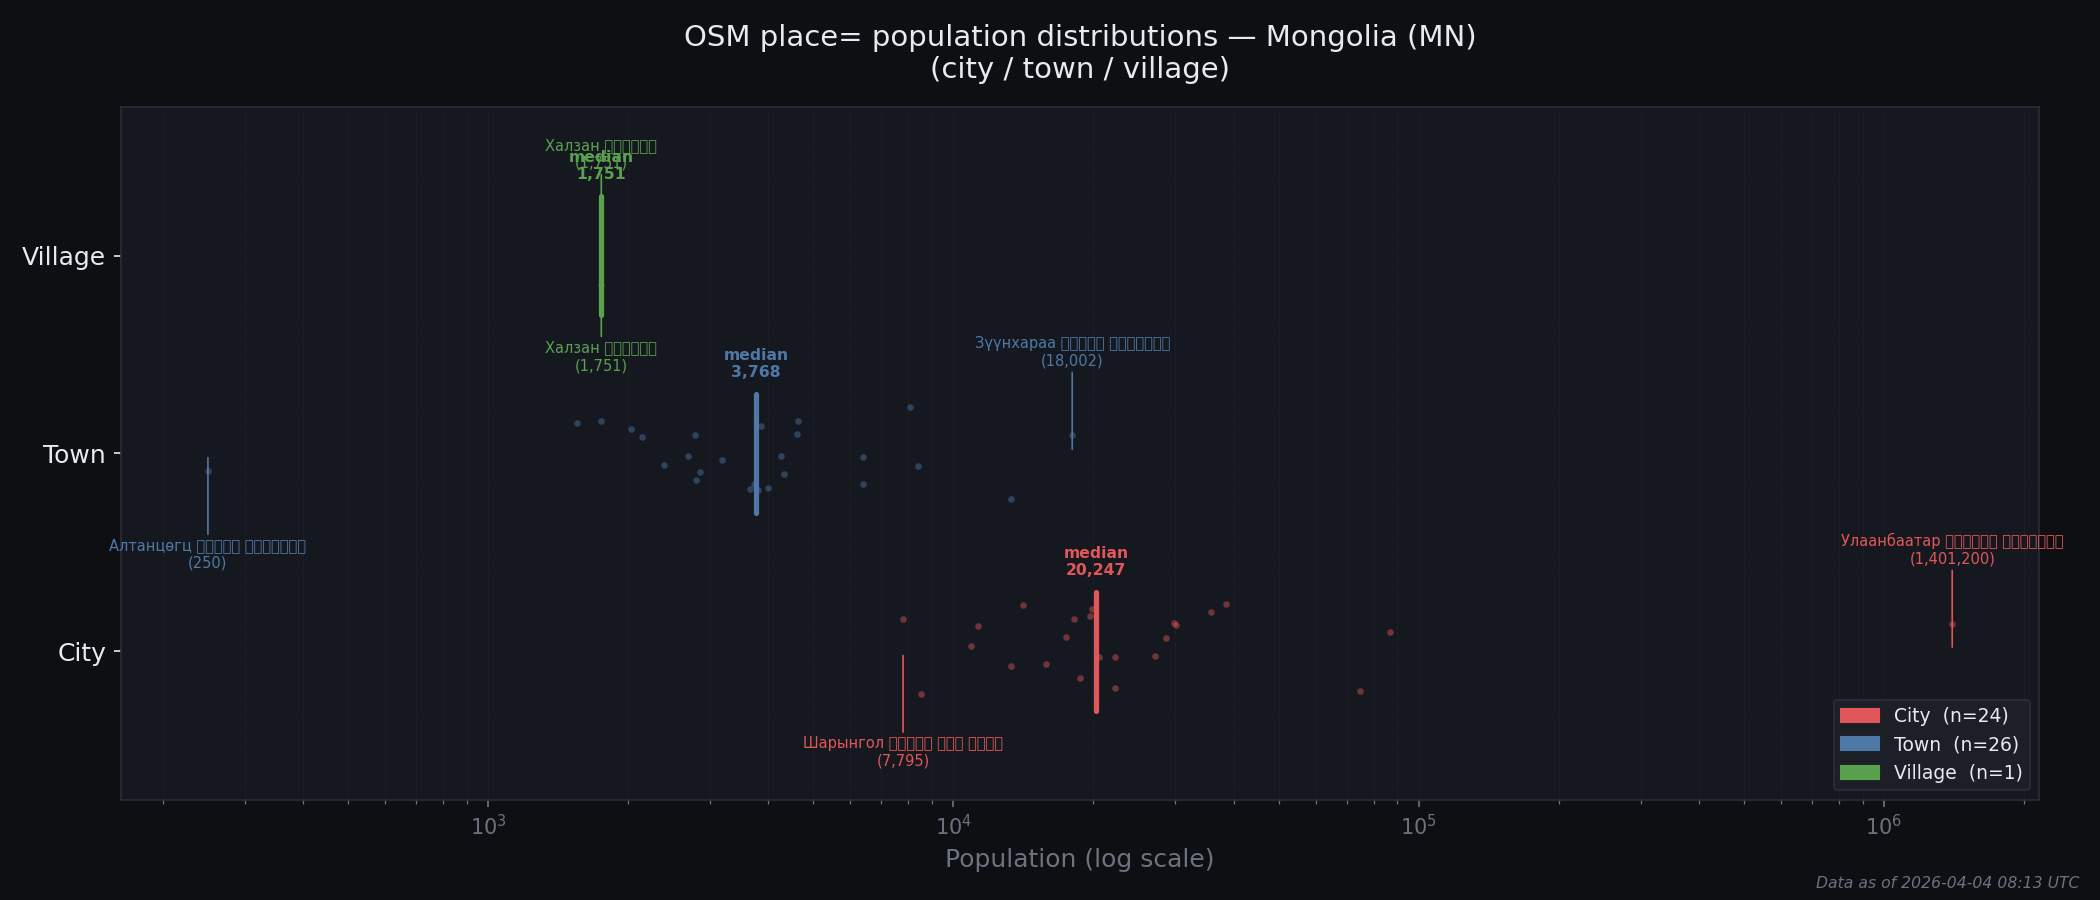
Population Distribution
Population distribution by place type for Mongolia. Dots show individual tagged places, with the maximum, minimum, and median population values highlighted.
Upgrade Candidates
Places whose population is more consistent with the next-higher type's distribution than their own. Ranked by signal strength, then percentile within current type.
| # | Name | Type | Population | Own %ile | %ile among next higher | Signal | Edit | OSM |
|---|---|---|---|---|---|---|---|---|
| 1 | Зүүнхараа ᠵᠡᢉᠦᠨ ᠬᠠᠷᠠᠭᠠ | town | 18,002 | 100% | 33% | Strong | node/512096561 | |
| 2 | Замын-Үүд ᠵᠠᠮ ᠤᠨ ᠡᠭᠦᠳᠡ | town | 13,285 | 96% | 17% | Weak | node/459470390 | |
| 3 | Халзан ᠬᠠᠯᠵᠠᠨ | village | 1,751 | 0% | 8% | Weak | node/3774871380 |
Downgrade Candidates
Places whose population is more consistent with the next-lower type's distribution than their own. Ranked by signal strength, then percentile within current type.
| # | Name | Type | Population | Own %ile | %ile among next lower | Signal | Edit | OSM |
|---|---|---|---|---|---|---|---|---|
| 1 | Шарынгол ᠱᠠᠷᠠ ᠶᠢᠨ ᠭᠣᠣᠯ | city | 7,795 | 4% | 85% | Weak | node/294089020 | |
| 2 | Чойр ᠴᠣᠶᠢᠷ | city | 8,526 | 8% | 92% | Weak | node/297282778 |
Monitor
Places that are consistent with their current type's distribution but sit at an extreme percentile within it. No reclassification signal yet, but worth revisiting as more population data is tagged.
| # | Name | Type | Population | Own %ile | Edit | OSM |
|---|---|---|---|---|---|---|
| 1 | Хархорин ᠬᠠᠷᠠ ᠬᠣᠷᠢᠨ | town | 8,411 | 92% | node/690895589 | |
| 2 | Наран ᠨᠠᠷᠠᠨ | town | 1,550 | 8% | node/3774871383 | |
| 3 | Алтанцөгц ᠠᠯᠲᠠᠨ ᠴᠥ᠋ᠭᠦᠴᠡ | town | 250 | 4% | node/659581170 |