Population Distribution
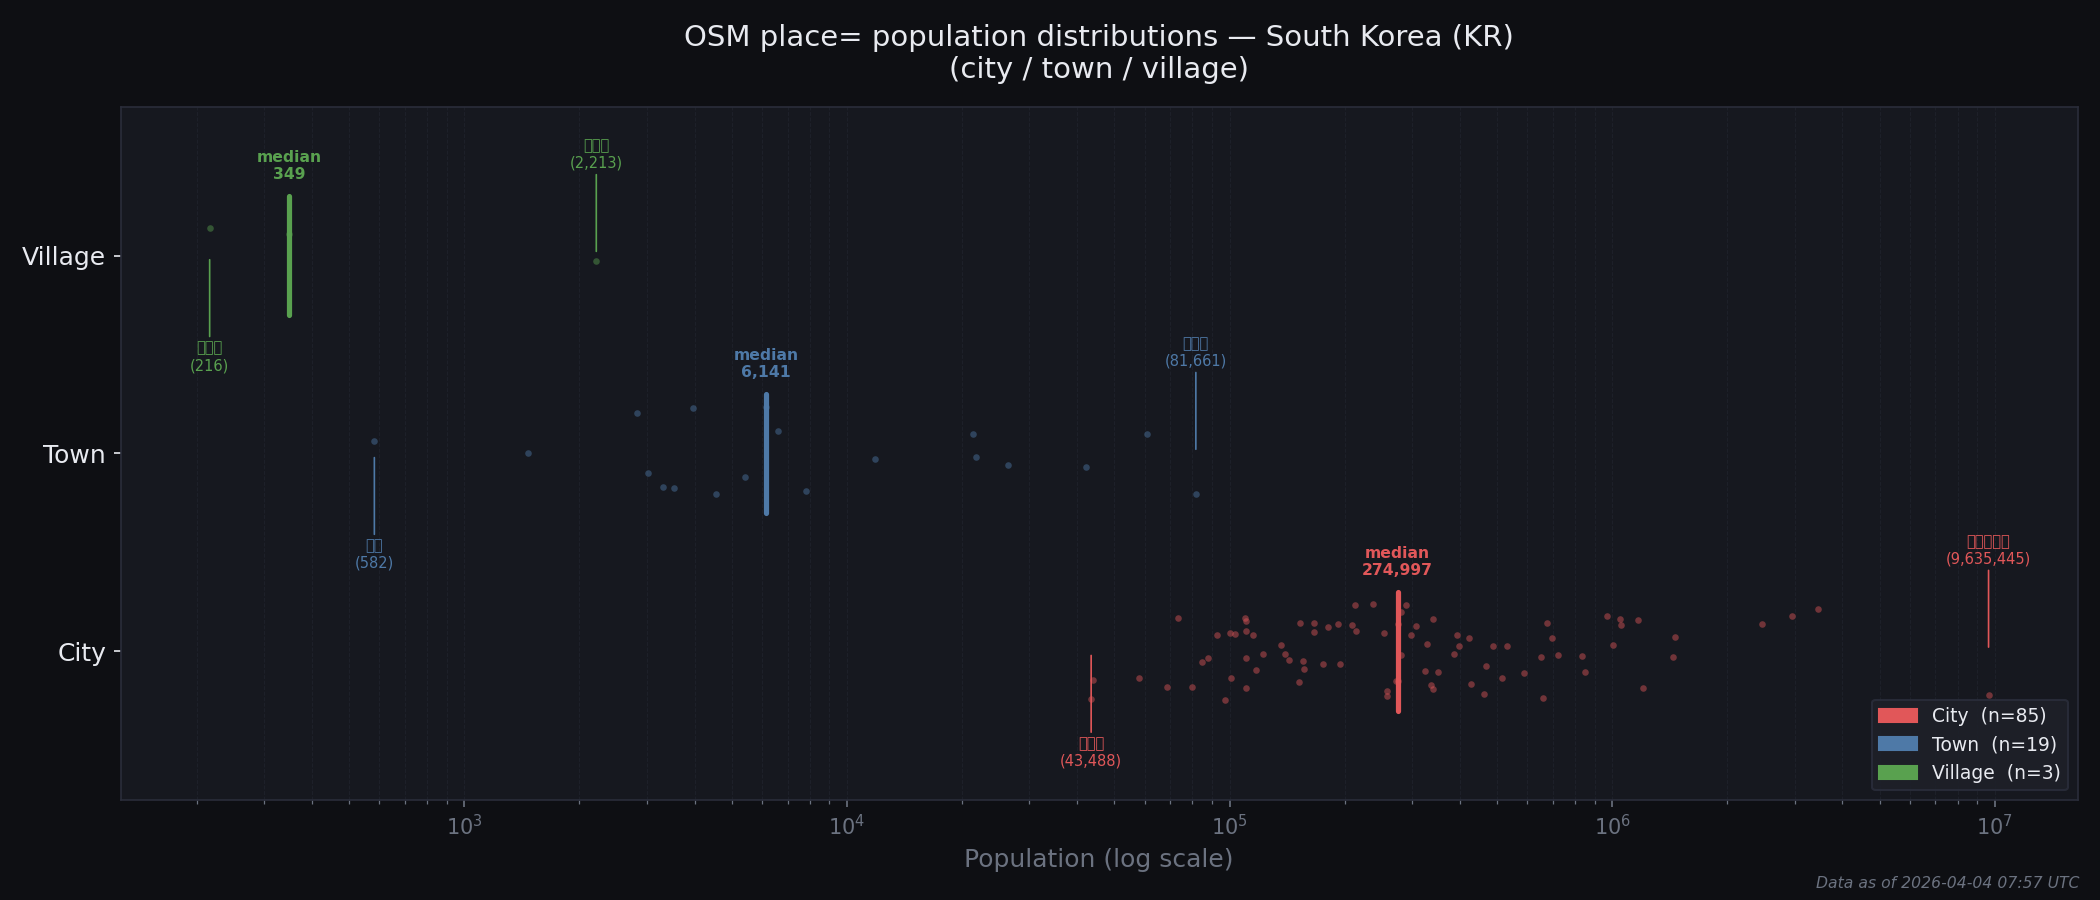
Population distribution by place type for South Korea. Dots show individual tagged places, with the maximum, minimum, and median population values highlighted.
Upgrade Candidates
Places whose population is more consistent with the next-higher type's distribution than their own. Ranked by signal strength, then percentile within current type.
| # | Name | Type | Population | Own %ile | %ile among next higher | Signal | Edit | OSM |
|---|---|---|---|---|---|---|---|---|
| 1 | 배방읍 | town | 81,661 | 100% | 7% | Weak | node/415157947 | |
| 2 | 연평리 | village | 2,213 | 100% | 10% | Weak | node/4780378992 | |
| 3 | 오창읍 | town | 60,882 | 95% | 4% | Weak | node/415159708 |
Downgrade Candidates
Places whose population is more consistent with the next-lower type's distribution than their own. Ranked by signal strength, then percentile within current type.
| # | Name | Type | Population | Own %ile | %ile among next lower | Signal | Edit | OSM |
|---|---|---|---|---|---|---|---|---|
| 1 | 율면 | town | 582 | 5% | 67% | Strong | node/415155795 | |
| 2 | 태백시 | city | 43,488 | 1% | 90% | Weak | node/6919770645 | |
| 3 | 계룡시 | city | 44,042 | 2% | 90% | Weak | node/415161986 | |
| 4 | 가사문학면 | town | 1,468 | 10% | 67% | Weak | node/415146453 |
Monitor
Places that are consistent with their current type's distribution but sit at an extreme percentile within it. No reclassification signal yet, but worth revisiting as more population data is tagged.
| # | Name | Type | Population | Own %ile | Edit | OSM |
|---|---|---|---|---|---|---|
| 1 | 김제시 | city | 87,782 | 9% | node/358015517 | |
| 2 | 남원시 | city | 84,856 | 8% | node/358015558 | |
| 3 | 속초시 | city | 79,586 | 7% | node/415151931 | |
| 4 | 문경시 | city | 73,294 | 6% | node/358015543 | |
| 5 | 삼척시 | city | 68,807 | 5% | node/415154216 | |
| 6 | 과천시 | city | 58,018 | 4% | node/1910974426 |