Population Distribution
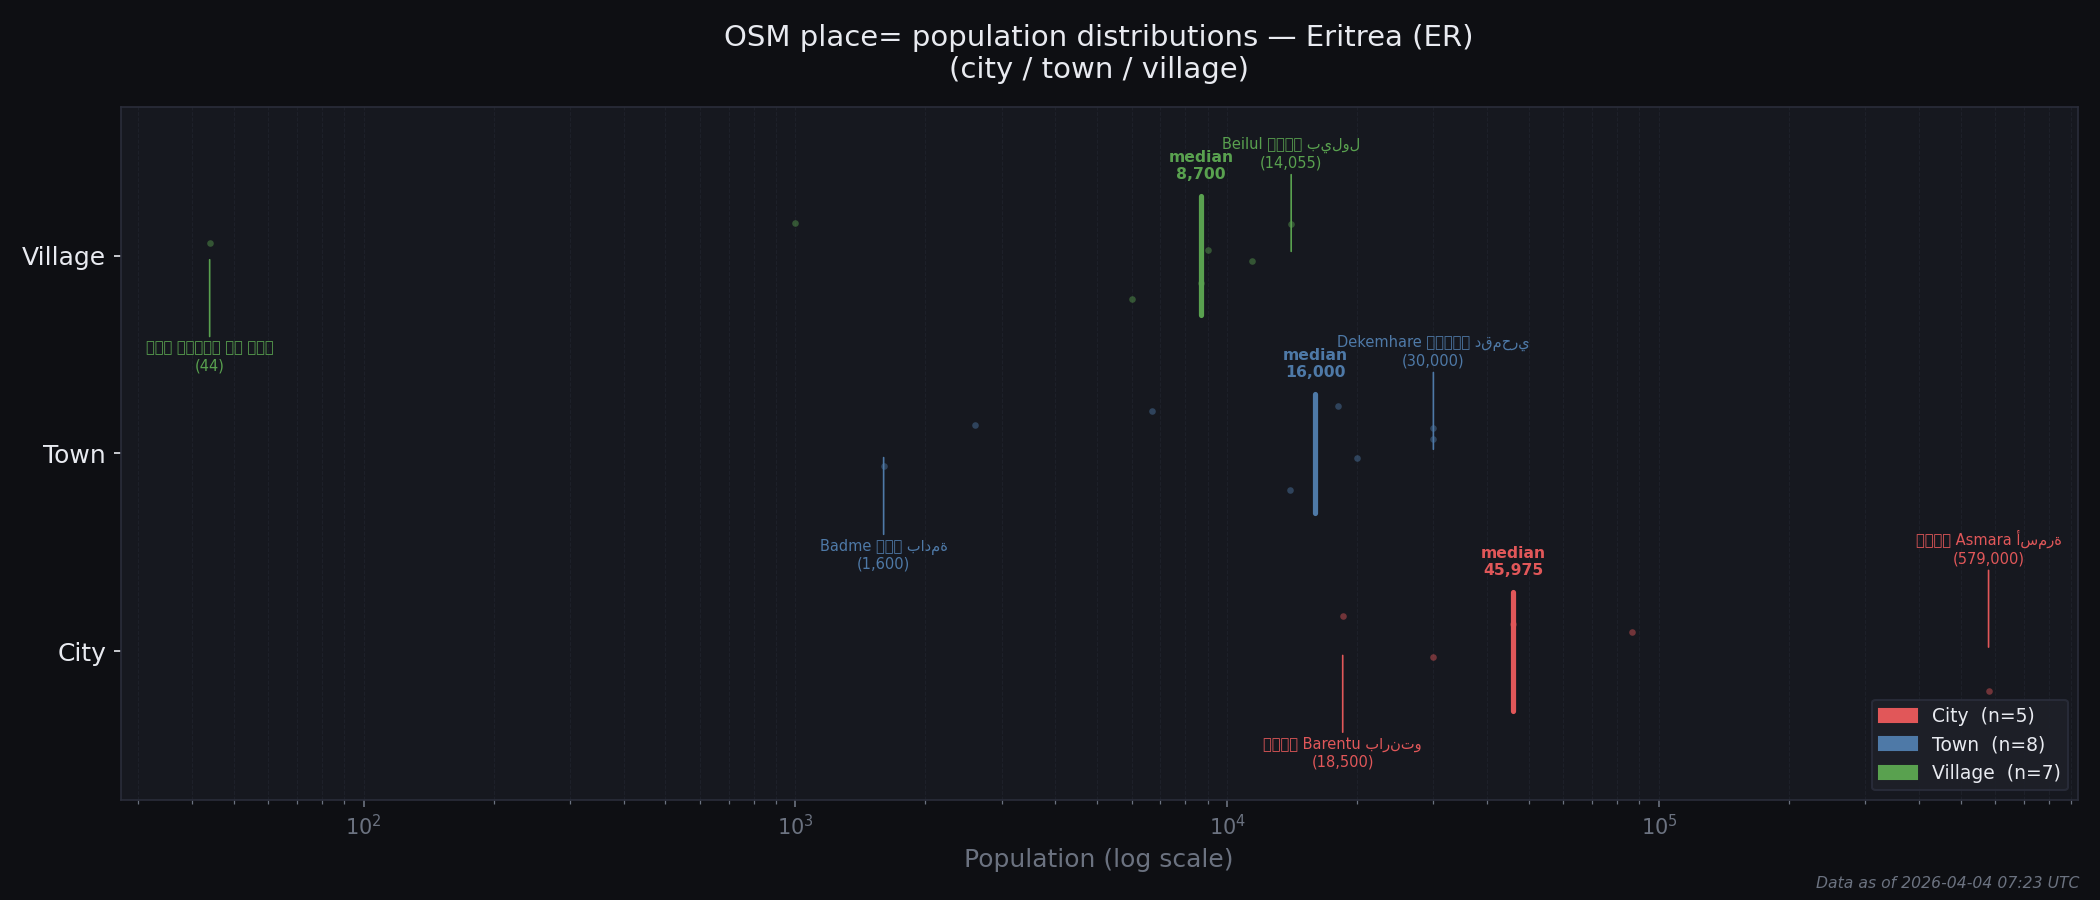
Population distribution by place type for Eritrea. Dots show individual tagged places, with the maximum, minimum, and median population values highlighted.
Upgrade Candidates
Places whose population is more consistent with the next-higher type's distribution than their own. Ranked by signal strength, then percentile within current type.
| # | Name | Type | Population | Own %ile | %ile among next higher | Signal | Edit | OSM |
|---|---|---|---|---|---|---|---|---|
| 1 | ኣቑርደት Akordat أغوردات | town | 30,000 | 100% | 40% | Weak | node/321209318 | |
| 2 | Dekemhare ደቀምሓረ دقمحري | town | 30,000 | 100% | 40% | Weak | node/4266676795 | |
| 3 | Beilul በይሉል بيلول | village | 14,055 | 100% | 50% | Weak | node/321268775 | |
| 4 | Marsa Fatima ማርሳ ፋጥማ مرسى فاطمة | village | 11,400 | 86% | 38% | Weak | node/2207879380 | |
| 5 | ዒላበርዕድ Elabered علابرعد | village | 9,000 | 71% | 38% | Weak | node/3546823016 | |
| 6 | ሕምብርቲ Himbirti حمبرتي | village | 8,700 | 57% | 38% | Weak | node/3253235445 | |
| 7 | Nefasit ነፋሲት نفاسيت | village | 6,000 | 43% | 25% | Weak | node/3632097426 |
Downgrade Candidates
Places whose population is more consistent with the next-lower type's distribution than their own. Ranked by signal strength, then percentile within current type.
| # | Name | Type | Population | Own %ile | %ile among next lower | Signal | Edit | OSM |
|---|---|---|---|---|---|---|---|---|
| 1 | Badme ባድመ بادمة | town | 1,600 | 12% | 29% | Weak | node/2304527878 | |
| 2 | ባረንቱ Barentu بارنتو | city | 18,500 | 20% | 62% | Weak | node/317148383 | |
| 3 | ሻምብቆ Shambiko شامبيكو | town | 2,600 | 25% | 29% | Weak | node/321218257 |
Monitor
Places that are consistent with their current type's distribution but sit at an extreme percentile within it. No reclassification signal yet, but worth revisiting as more population data is tagged.
No places in the monitor tier.