Population Distribution
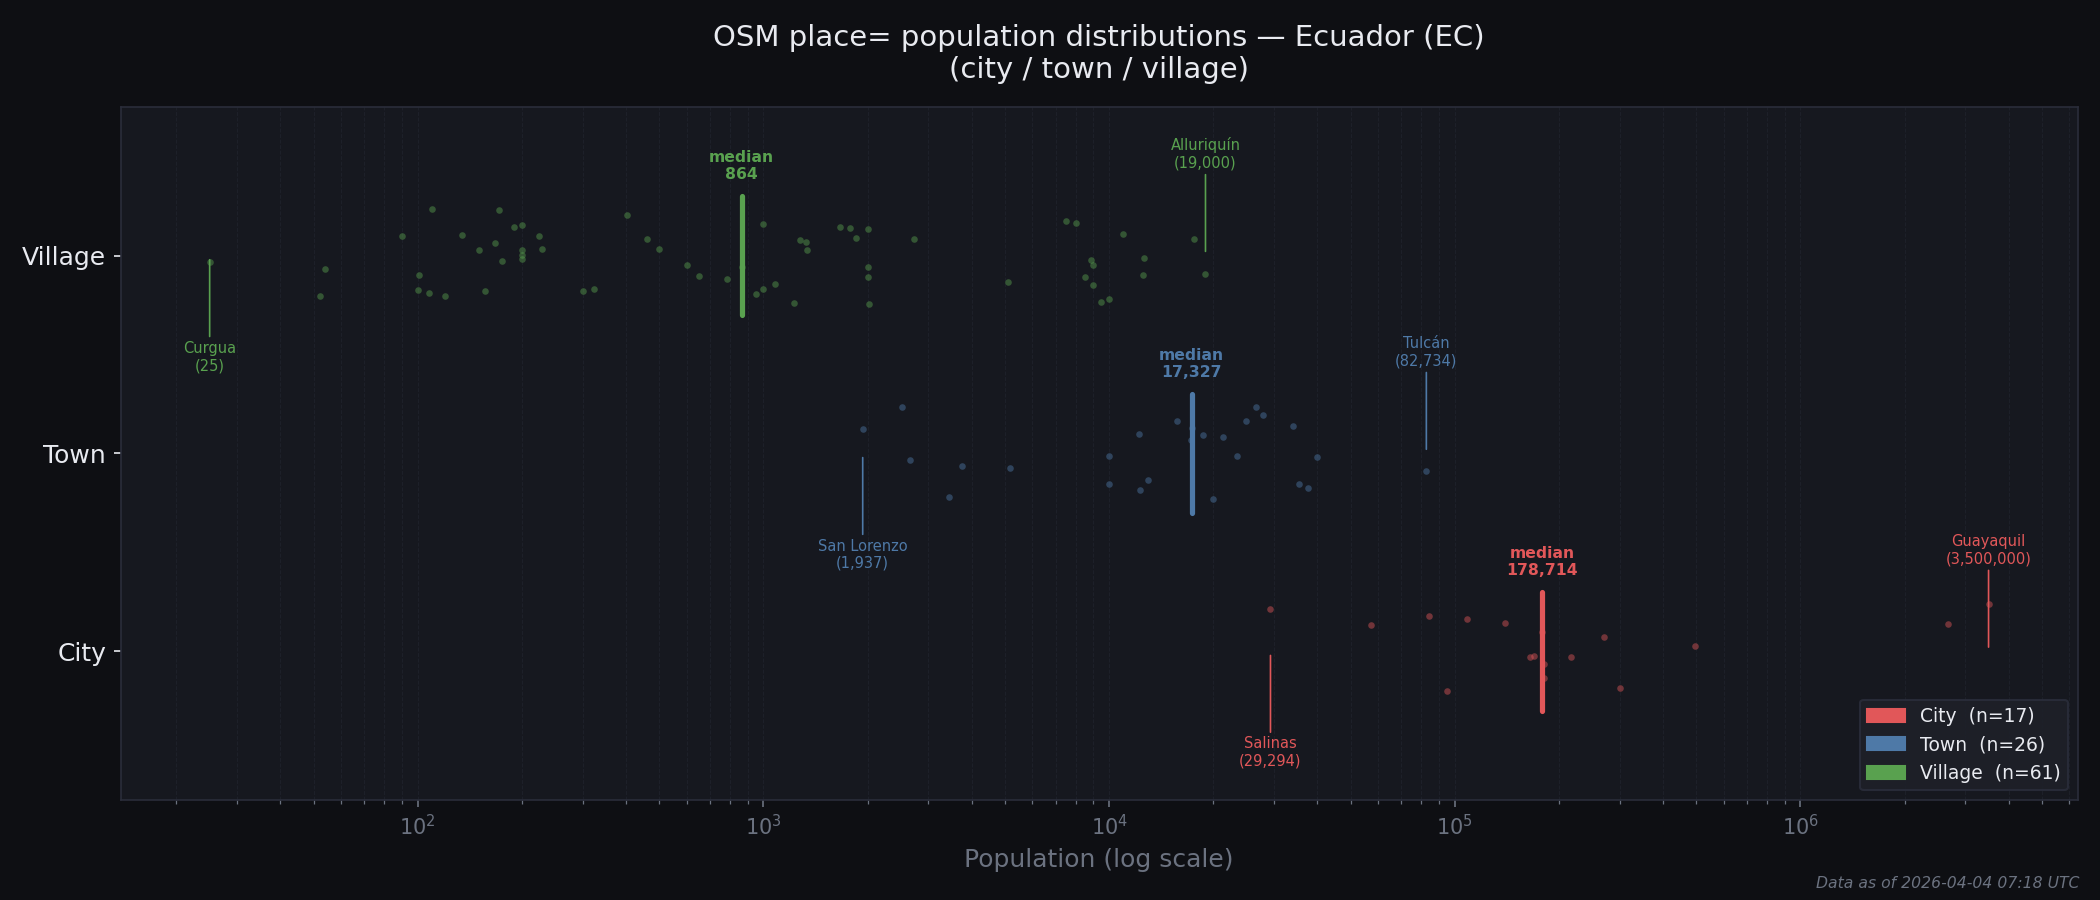
Population distribution by place type for Ecuador. Dots show individual tagged places, with the maximum, minimum, and median population values highlighted.
Upgrade Candidates
Places whose population is more consistent with the next-higher type's distribution than their own. Ranked by signal strength, then percentile within current type.
| # | Name | Type | Population | Own %ile | %ile among next higher | Signal | Edit | OSM |
|---|---|---|---|---|---|---|---|---|
| 1 | Alluriquín | village | 19,000 | 100% | 58% | Strong | node/249420687 | |
| 2 | La Guayas | village | 17,579 | 98% | 54% | Strong | node/5124939549 | |
| 3 | Puerto Limón | village | 12,588 | 97% | 38% | Strong | node/249597847 | |
| 4 | Luz de America | village | 12,529 | 95% | 38% | Strong | node/529913610 | |
| 5 | San Jacinto del Búa | village | 11,000 | 93% | 31% | Strong | node/6303548216 | |
| 6 | Santa Maria del Toachi | village | 10,000 | 92% | 31% | Strong | node/2506430541 | |
| 7 | Nuevo Israel | village | 9,500 | 90% | 23% | Strong | node/1701658230 | |
| 8 | El Esfuerzo | village | 9,000 | 88% | 23% | Strong | node/249423416 | |
| 9 | Las Delicias | village | 9,000 | 88% | 23% | Strong | node/2506430142 | |
| 10 | Palanda | village | 8,873 | 85% | 23% | Strong | node/249596342 | |
| 11 | Chaguarpamba | village | 8,512 | 84% | 23% | Strong | node/249422560 | |
| 12 | San Juan del Búa | village | 8,000 | 82% | 23% | Strong | node/249421901 | |
| 13 | Plan Piloto | village | 7,500 | 80% | 23% | Strong | node/2506430281 | |
| 14 | Tulcán | town | 82,734 | 100% | 12% | Weak | node/249599402 | |
| 15 | Playa del Muerto | village | 5,097 | 79% | 19% | Weak | node/2506430282 |
Downgrade Candidates
Places whose population is more consistent with the next-lower type's distribution than their own. Ranked by signal strength, then percentile within current type.
| # | Name | Type | Population | Own %ile | %ile among next lower | Signal | Edit | OSM |
|---|---|---|---|---|---|---|---|---|
| 1 | San Lorenzo | town | 1,937 | 4% | 69% | Strong | node/249598535 | |
| 2 | Salinas | city | 29,294 | 6% | 81% | Weak | node/249598984 | |
| 3 | Gonzanamá | town | 2,521 | 8% | 75% | Weak | node/249423752 | |
| 4 | Guamote | town | 2,648 | 12% | 75% | Weak | node/3390412558 | |
| 5 | Amaluza | town | 3,438 | 15% | 77% | Weak | node/249420725 |
Monitor
Places that are consistent with their current type's distribution but sit at an extreme percentile within it. No reclassification signal yet, but worth revisiting as more population data is tagged.
| # | Name | Type | Population | Own %ile | Edit | OSM |
|---|---|---|---|---|---|---|
| 1 | Jipijapa | town | 39,816 | 96% | node/249429318 | |
| 2 | Puyo | town | 37,600 | 92% | node/249597016 |